
Let’s be honest, basic logging is not hard. Watching logs scroll by is just a tail away. Even shipping most logs to other hosts isn’t hard. However when you start adding these things together, throw in a dash of web interface, a sprinkle of filtering and a heavy dollop of integration… it gets to be a rather large “hack”. So why hack it when you can use a ready-made solution for next to no cost? That’s what I found in Papertrail.
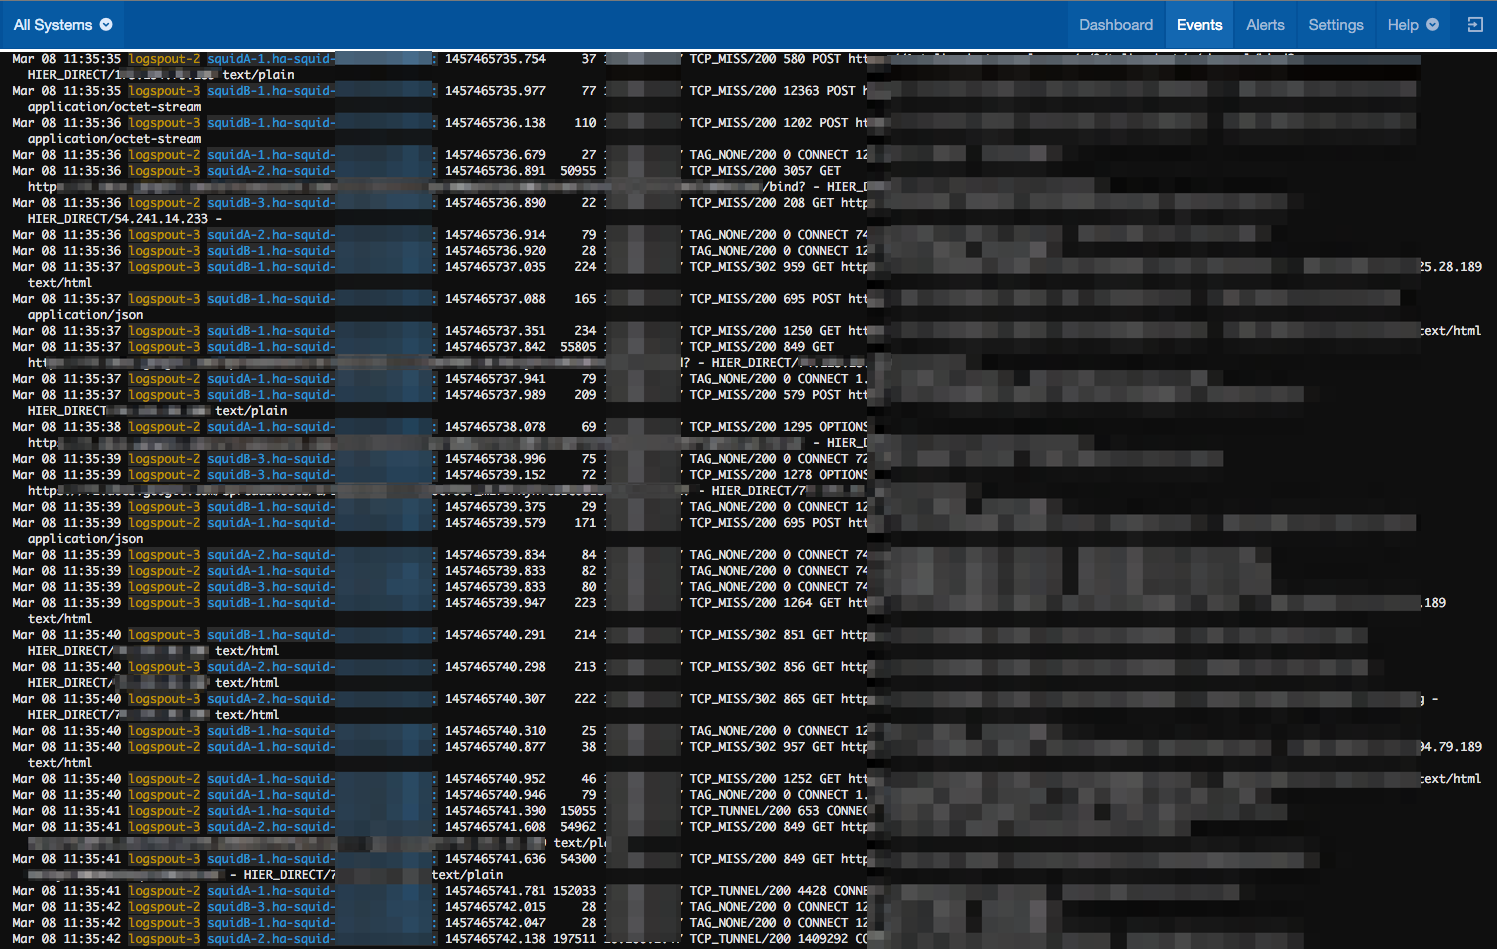
My specific use case was monitoring and logging a variable number of Squid proxies running in Docker containers. Squid was setup to log to /dev/stdout which makes it easy to watch in your favorite Docker interface, however monitoring multiple copies at the same time (since the traffic is load balanced evenly) proved to be an annoyance. There are other logging solutions available to me, but this data is something I wanted to be able to regularly look at and didn’t care about keeping. Papertrail turned out to be perfect for this scenario.
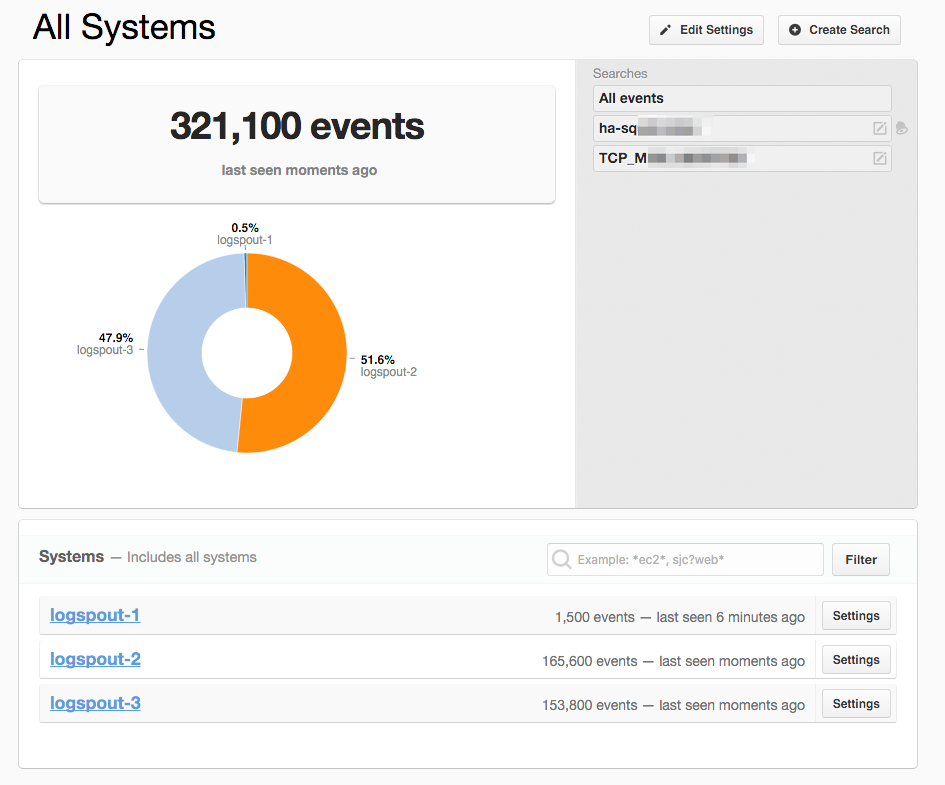
The pricing is a great start. 100 MB/month for free (with 48 hours of searching) is more than enough for most small projects. The biggest concern is the search time, but rarely do most people need to go back more than a day or two searching logs. If you want something more than their free plan, it’s totally customizable. One could opt for 1 GB/mo with 1 day of search for just $5/mo or 4 weeks of search for $14/mo. The volume of logs and duration of search is whatever makes you happy. For me it’s 2 GB/mo and 3 days of search for $15/mo. There’s even an option to push the archives into AWS S3 which I don’t utilize since my data is transient.
There are also a number of bonus features such as the ability to save searches and push alerts into other systems. The alert service list includes a wide range of common targets (such as CloudWatch, Boundry, DataDog and Pagerduty), along with some more versatile options (such as SNS, Slack and Webhooks). They’ve obviously put some thought into the alerting piece since you can configure the frequency and minimum number of matching events. Smart users will be able to take the output of these “alerts” and extend it even further.
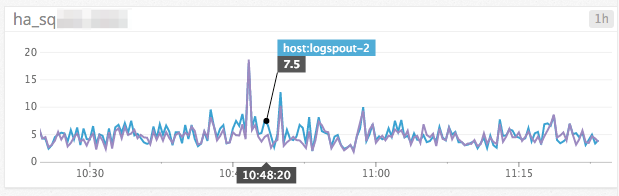
For example, my preference in output is Datadog which I’ve used to generate the real-time traffic chart you see to the left. That chart goes up on my Docker dashboard where I can easily compare in-app events (i.e. hits to Squid) against other system statistics (i.e. bandwidth usage).
If you happen to be interested in logging Docker containers as well, there is a one line solution to start a logspout container. Between the ease of launching a container and Papertrail, there is no reason you shouldn’t be up and logging in less than 5 minutes.